
The problem
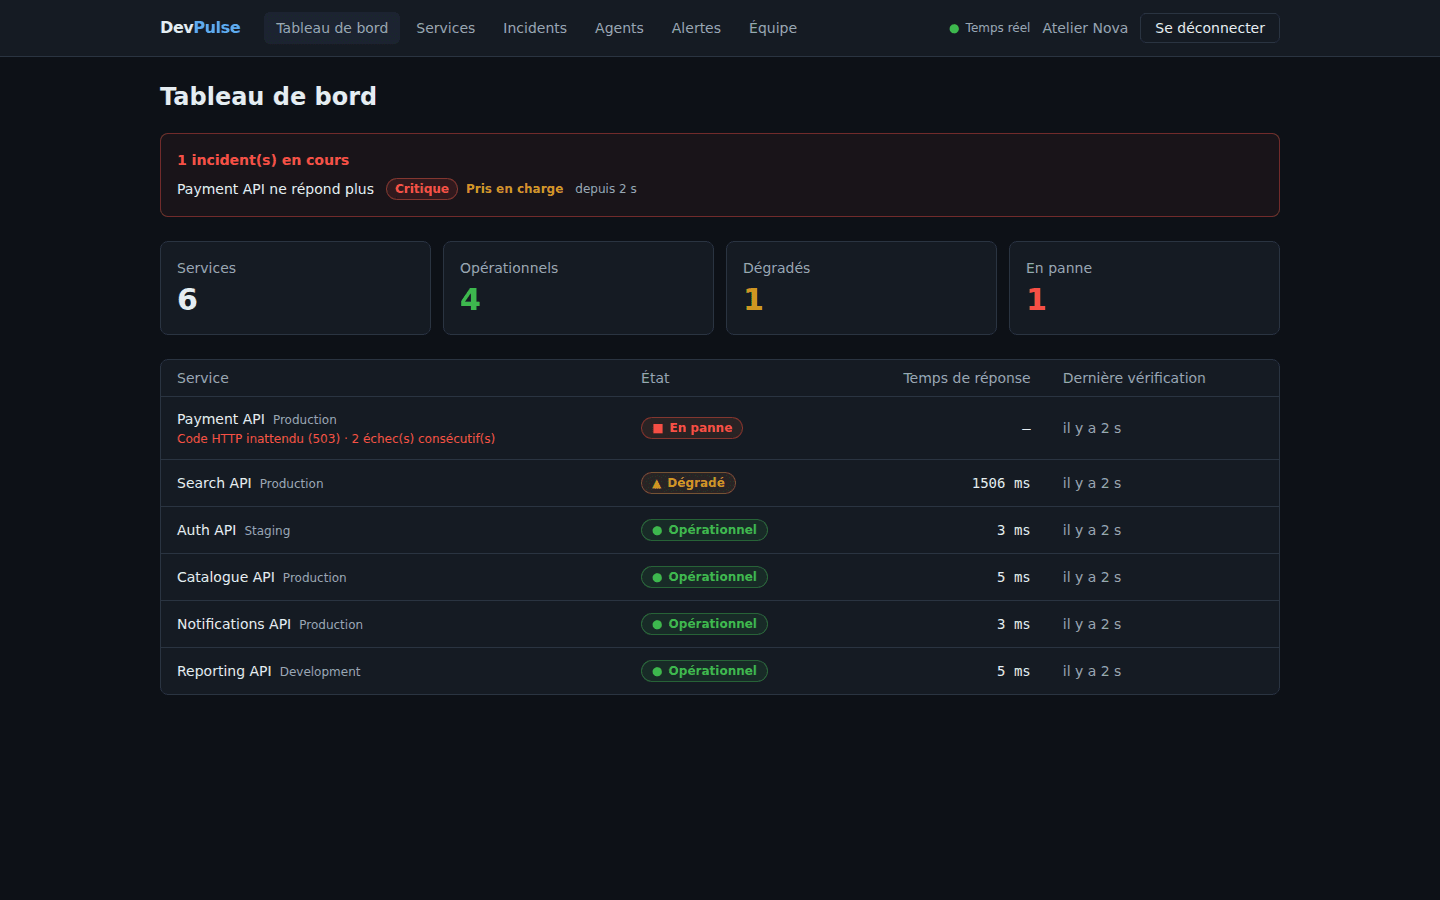
An API goes down at night. You need to know fast, know who is on it, warn the right people, keep a record, and not wake anyone up over a single lost packet. DevPulse does this for several organizations at once: each team registers its APIs, DevPulse probes them, opens an incident when an outage is confirmed and closes it when the service is back.
Hybrid monitoring
HTTP probes from the platform, plus a Linux or Windows agent for machines on a private network, each with its own revocable key.
Incidents
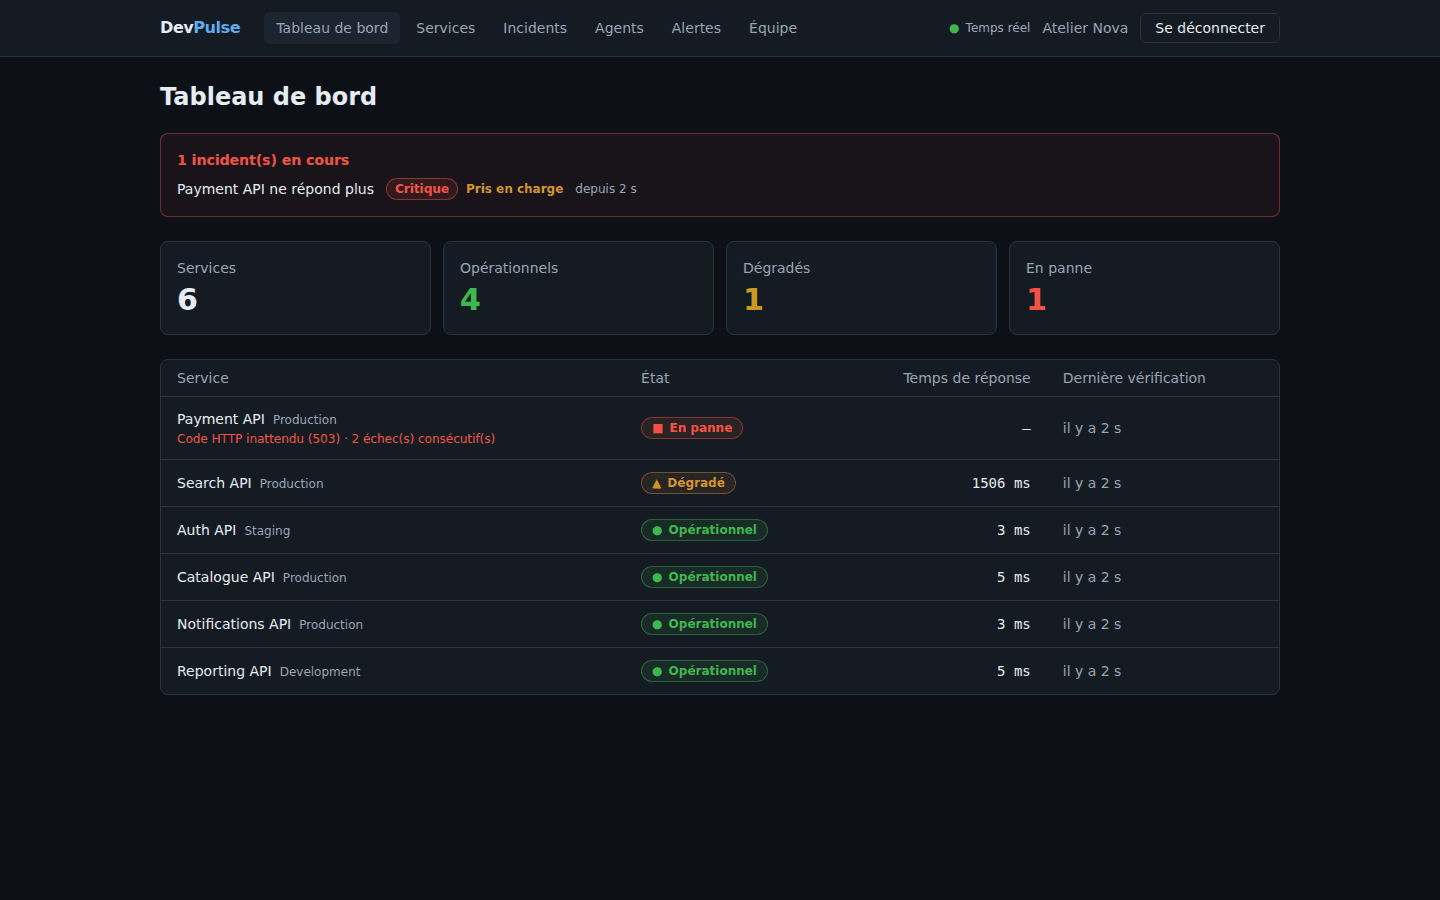
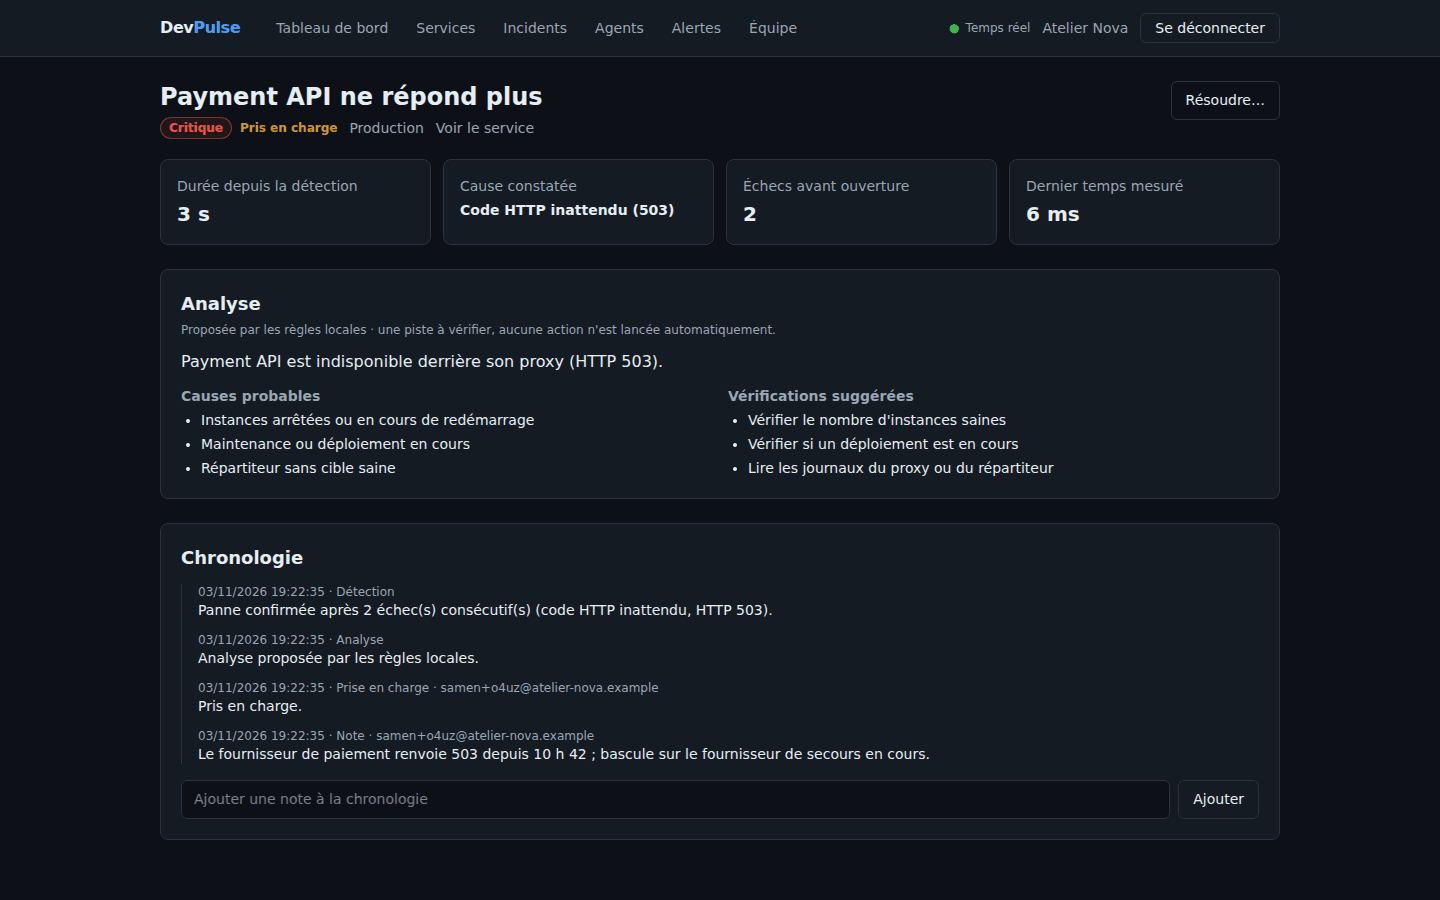
Opened on the second consecutive failure, acknowledged, annotated, closed automatically when the service recovers, with a timeline and time to resolution.
Alerts
HMAC-signed webhooks and Slack, with rules per event and environment, retries with growing delays and a delivery history.
Analysis and real time
Suggested causes and checks (local rules or any OpenAI-compatible model), and a dashboard that updates live.
Architecture
Seven .NET 10 components, each with its own PostgreSQL database: Identity, Registry, Monitoring (API and probe worker), Incident, Alerting, an analysis worker and a YARP gateway. They share no tables; they exchange events through RabbitMQ. The front end is Vue 3.
I started from a requirements document and a technical blueprint, and corrected them while implementing. The blueprint bound a queue to monitoring.service.* while routing keys had four segments: in AMQP, * matches exactly one word, so that queue would never have received anything, with no error at all. Decisions are recorded in 17 ADRs.
Lose no event, process none twice
This is the core of the project. I wrote the messaging layer directly on RabbitMQ.Client instead of MassTransit, whose version 9 is commercial.
- Outbox: the event is stored in the same transaction as the change it announces, then published with broker confirmation. If RabbitMQ is down, it waits in the database.
- Idempotency: each consumer records the event id inside the transaction of its own processing. A duplicate is acknowledged with no effect.
- Retries: a time-to-live queue sends the message back after a delay, then a dead-letter queue keeps it with its last error.
db.Set<ProcessedMessage>().Add(ProcessedMessage.Create(integrationEvent.EventId, registration.Queue, clock.GetUtcNow()));
try
{
    await db.SaveChangesAsync(ct);
}
catch (DbUpdateException e) when (DbErrors.IsUniqueViolation(e))
{
    return false; // already processed: acknowledged with no effect
}

await route.Invoke(services, integrationEvent, ct);
await db.SaveChangesAsync(ct);
await transaction.CommitAsync(ct);
My first duplicate test passed for the wrong reason: run alone against a fresh broker, it published before the queue existed, the message vanished, and the test stayed green even without deduplication. I only caught it by breaking deduplication on purpose. Since then, every important safeguard is checked that way.
Security
- RS256 tokens: only Identity holds the private key, so a compromised service cannot mint tokens.
- Sessions: the access token lives in memory only; the refresh token sits in an
HttpOnlycookie and is replaced on every use. A replayed token revokes its whole family. - Tenant isolation: explicit in every query. Another organization's resource answers 404, real-time feed included, and tests check it service by service.
- SSRF: monitored URLs and webhooks are user-supplied. The check that counts runs on the address actually connected to, at connection time, which holds against DNS rebinding.
Who watches the watcher?
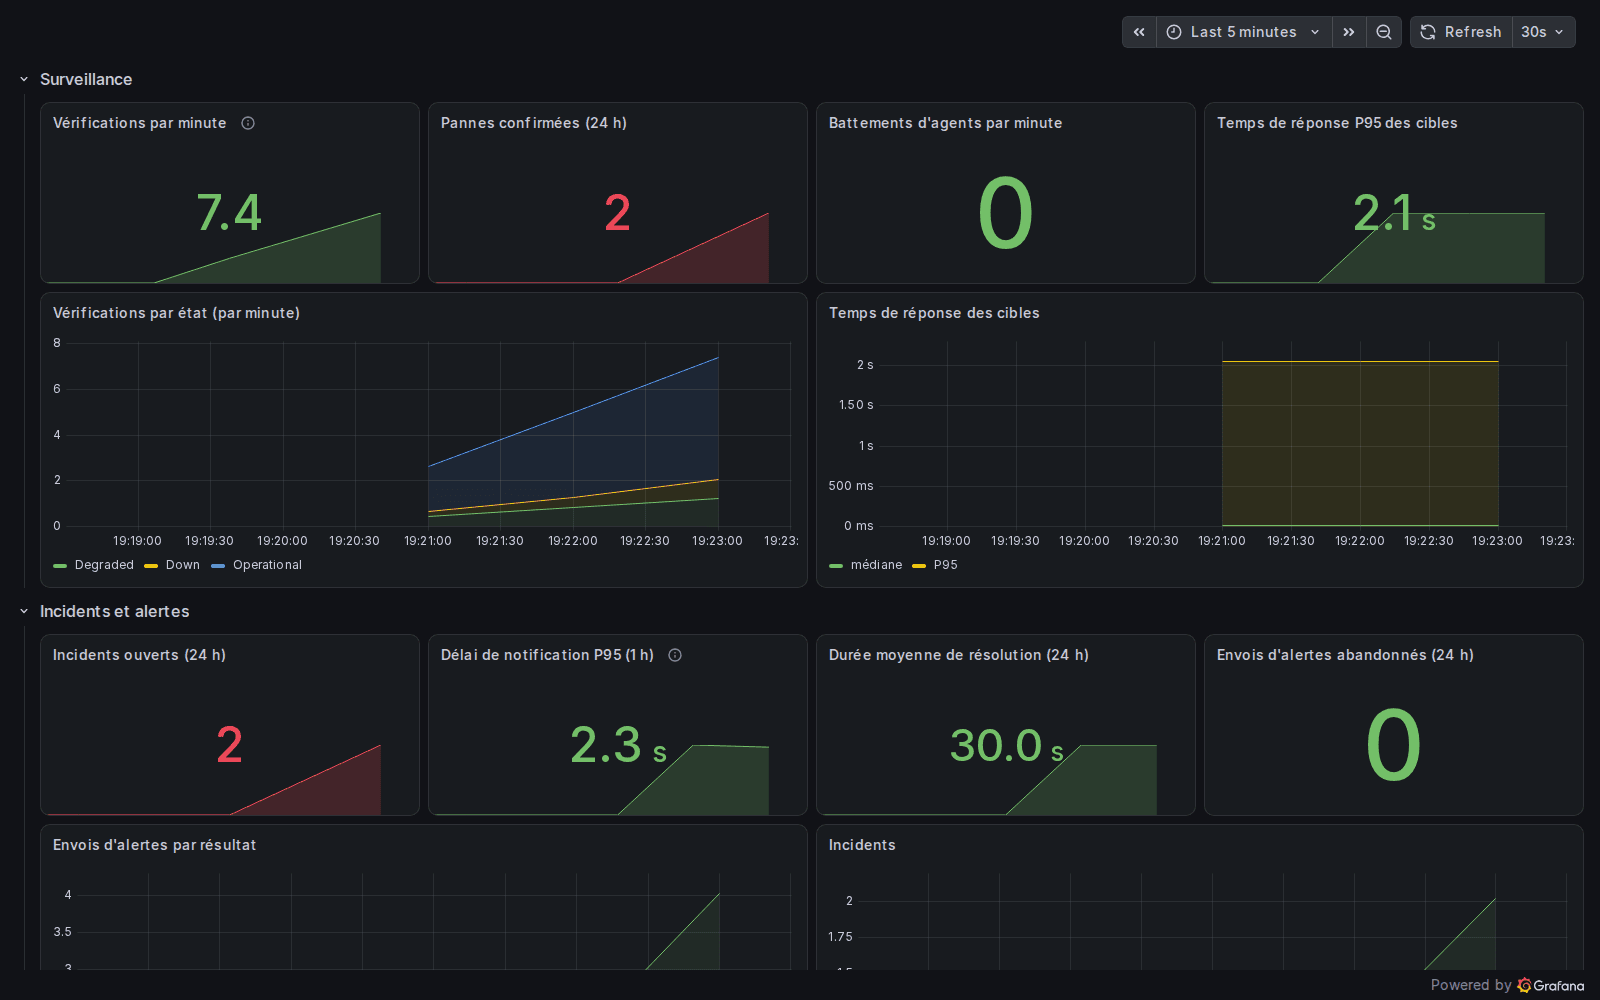
DevPulse monitors itself with OpenTelemetry: checks per minute, dead-lettered messages, outbox age, notification delay, and traces that follow an outage from the probe to the webhook. Locally everything lands in Grafana, with a versioned dashboard and five alert rules. On Azure, the same telemetry goes to Application Insights.
What is verified
257 .NET tests
Against real PostgreSQL and RabbitMQ (Testcontainers), plus 34 Vitest tests for the front end.
7 browser journeys
Playwright, run in CI against the Docker images of the whole platform: outage, incident, webhook, invitation, isolation.
Alert in 26 to 73 ms
From confirmed outage to signed webhook received, over four measurements (laptop and CI). The target was 10 s.
Load
k6 in CI: about 46,000 requests in 30 s for 20 users, no errors, 95% under 21 ms.
CI builds the images, starts the full platform, replays the journeys, runs the load test, checks that metrics and traces reach Grafana, and validates the AWS (ECS Fargate) and Azure (Container Apps) Terraform.
Not deployed to the cloud yet: both Terraform stacks are validated and costed, not applied. The next step is a demo deployment on Azure Container Apps. Built with the help of an AI coding assistant; choices, measurements and their limits are documented in the repository.
What I take away
A distributed system is judged by what it does when something fails: a missing broker, a message delivered twice, a recovery that arrives before the outage it ends. Writing those guarantees myself, then breaking each one on purpose to watch the test fail, taught me more than a framework that would have hidden them. The other lesson: a number is only worth something with its conditions. Every measurement in this project says where and how it was taken.